


You know the visceral moment when your CI/CD pipeline stalls and dashboards go red — that instant fuels the blog about the sheer panic when they systems and automations fail!
Did You Know?
Many major incidents begin with a small automation or config change—think a misconfigured Kubernetes deployment or a Jenkins pipeline that pushes a bad script—then cascade in minutes.
Source: Postmortems from SRE teams
You’ll learn how outages from Kubernetes, Jenkins, AWS Lambda, or misconfigured Terraform impact ops, finance, and brand. We’ll examine common triggers—configuration drift, race conditions, deployment scripts—and practical preparedness: PagerDuty alerts, Datadog monitoring, runbooks, and incident roles to reduce MTTR.
Immediate impacts: operational, financial, and reputational
When systems and automations fail you see immediate operational breakdowns. Order pipelines on Shopify or Stripe stall, Zendesk queues spike, and Datadog or New Relic alerts either flood or go silent. Your fulfillment, billing, and monitoring teams scramble while PagerDuty escalations multiply.
Quick impacts visual
Order and fulfillment stalls
Shopify, Stripe, and custom order pipelines can freeze, delaying shipments and increasing cancellations.
Customer service overload
Zendesk and Intercom queues balloon, agents use Slack to triage while CX metrics worsen.
Monitoring failures and noise
Datadog, New Relic, or CloudWatch may flood with alerts or go silent, obscuring root cause.
Immediate financial hits
Lost checkout conversions, Stripe refunds, and expedited AWS contractor hours drive up costs.
Reputational erosion
Trustpilot, Twitter threads, and churn tracked in HubSpot undermine customer confidence.
Immediate impacts: operational, financial, and reputational
Short-term financial hits are tangible: lost revenue from failed checkouts, expedited remediation such as AWS incident response and contractor SRE hours, and refunds or chargebacks processed through Stripe. You may also incur regulatory fines if customer data in Salesforce or S3 buckets is exposed.
Reputational fallout is immediate: social media threads, Trustpilot complaints, and Slack-native customer escalations damage trust and increase churn. Monitoring blindspots make communication harder; Datadog dashboards may be misleading while your statuspage and incident commands in PagerDuty or Statuspage go unupdated. Many writers blog about the sheer panic when they systems and automations fail! Prioritize clear customer messages via Intercom or Salesforce to reduce erosion.
You should quantify downtime minutes, conversion loss, and incremental Google Ads spend needed to recover position. Repeated incidents inflate CAC, depress LTV, and increase churn tracked in HubSpot and notify legal teams.
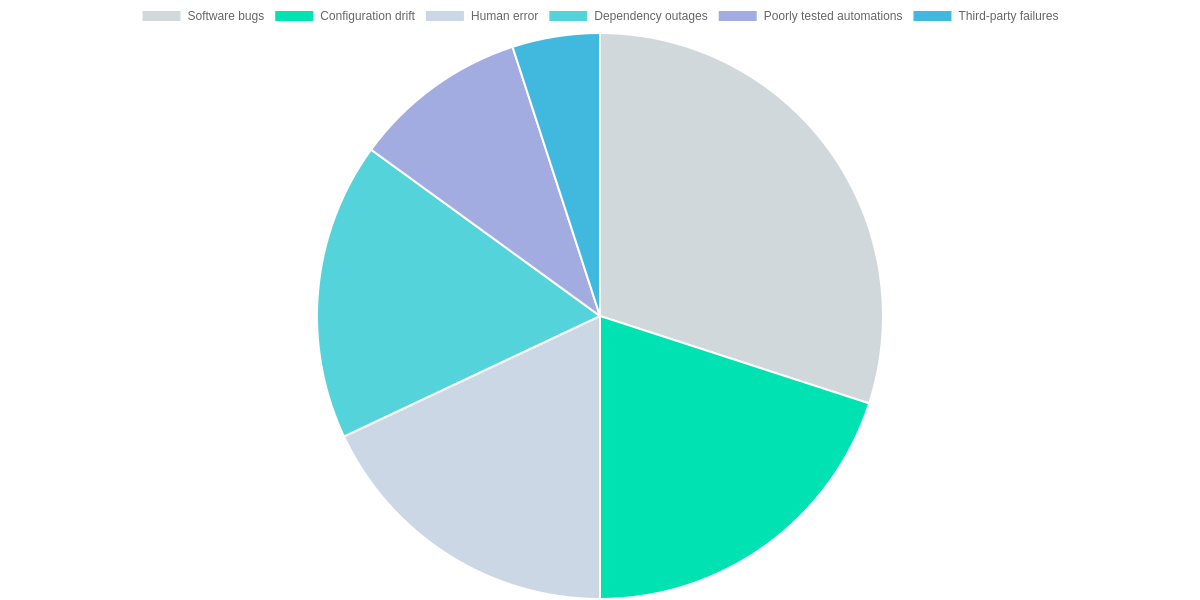
Common failure causes and patterns
Software bugs, configuration drift, dependency outages, human error, poorly tested automations, and third‑party failures are the primary triggers of system panic. Common concrete examples include a Kubernetes controller regression, a Redis client bug, Terraform drift after manual edits, and an AWS S3 or Cloudflare outage.
Quick Failure Snapshot
Key vectors that trigger shear panic in systems and automations, with concrete examples to relate to your stack.
- ✓ Software bugs (Kubernetes controller or Redis regression)
- ✓ Configuration drift (Terraform drift, Ansible divergence)
- ✓ Dependency outages (AWS S3, Cloudflare)
Failure patterns
Failures typically present as single‑point failures (a primary Postgres instance or a central Kafka broker) or cascading failures where one outage amplifies across services—for example, an S3 outage triggering Lambda retries and API Gateway timeouts. Observability via Datadog, Prometheus, and Jaeger tracing exposes propagation paths.
Mitigate proactively: run canary releases with Argo CD or Spinnaker, enforce terraform plan and Sentinel policies, gate features with LaunchDarkly, implement bulkheading and client fallbacks, and validate automations in CI via GitHub Actions and Chaos Mesh to catch brittle automation before production impact.
Frequently Asked Questions
Understand common causes, recovery targets, and first moves when automations fail. Frequent culprits include Zapier, AWS Lambda, and Salesforce API changes. Aim for RTO under thirty minutes for customer-facing flows. Immediately flip feature flags, disable affected Zapier zaps, trigger PagerDuty, and notify customers via Slack, and rollback Jenkins quickly too.
FAQ: Failures, RTO, Immediate Actions
Why do automations fail? ▼
What RTO should I aim for? ▼
What immediate steps limit customer impact? ▼
Conclusion
You reduce the panic that follows outages by planning, testing, and documenting clear playbooks that everyone can follow. Tools like PagerDuty, Datadog, and Jira Service Management make alerts, observability, and runbook tracking actionable. Remember why you read this blog about the sheer panic when they systems and automations fail!
🎯 Key takeaways
- → Planning, testing, and clear playbooks cut incident panic and time-to-recovery.
- → Run audits, tabletop drills, and enforce measurable SLAs with PagerDuty, Datadog, and Jira.
- → Track MTTR, run scheduled chaos drills, and document post-incident actions for continuous improvement.
Next steps
Start with a full audit of observability and runbooks, and formalize SLAs with measurable MTTR targets. Run tabletop drills and scheduled chaos experiments, and track results in Jira and Datadog dashboards. Iterate postmortems in Slack channels, update playbooks, and practice until PagerDuty alerts feel routine. Measure progress monthly and report results.
